

Vegetation monitoring system
A SIGNIFICANT PART OF THE FAILURES IN THE OVERHEAD POWER LINE NETWORK OF POWER PLANTS CAN BE ATTRIBUTED TO THE VEGETATION PROLIFERATING ALONG THE TRAILS.
A significant part of maintenance costs is made up by the power lines safety zone cleaning costs and vegetation management works. Therefore, it is important that these activities are managed in a controlled and efficient way.
In the HAWK System Platform, it is possible to plan and manage work by importing company master data.
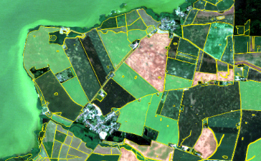
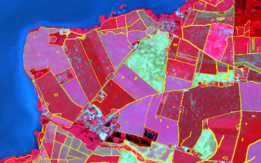
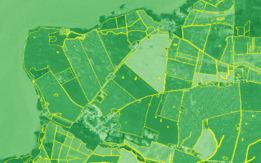
The vegetation and emergency situation management in safety zones can be implemented using real information from the environment. Satellite images are the most cost-effective way of monitoring the area around large networks.
Area of application medium and high voltage networks
Choose a plan
You can easily calculate the expected costs. Enter the length of the network you want to monitor.
basic
Source data: ESA Copernicus Sentinel 1 and 2, hybrid
target area of use: task planning, medium voltage – high voltage, overview.
Identification of trees and groups of trees with a canopy diameter of 5-10 m
Determination of the peak height of the identified vegetation with an average
error of ±2.5 m
standard
HR 3 m
Source data: Planet
Target area of use: task planning, medium voltage – high voltage, general view
Identification of trees and groups of trees with a canopy diameter of 3-5 m
Determination of the peak height of the identified vegetation with an average
error of ±1.5 m
extended
HR 1.5 m
Source data: SPOT 6-7
Target area of use: task planning, medium voltage – high voltage, general view
Identification of bushes and trees from a canopy diameter of 2-3m
Determination of the peak height of the identified vegetation with an average
error of ±1.5 m
ultimate
VHR < 1 m
Source data: ESA Pleiades, Kompsat 3-3A, WorldView 1-3
Target area of use: task execution control, urban area, low voltage, detailed view
Identification of trees and bushes from 1 m canopy diameter
Determination of the peak height of the identified vegetation with an average
error of ±1 m
The price per km is the annual cost. There are no hidden costs.*
*Note: BASIC is excellent for change management, so HAWK System recommends choosing one of the solutions with paid satellite images in addition to BASIC package to create your base vegetation database. After that, BASIC may be sufficient for annual change management, a high-resolution solution is required in unique areas such as mountainous areas and special forest areas.
**Note: Minimum 10 000 km, contact us for a personalised offer.
Custom map layers can be requested as an option:
Other country-specific maps provided by customer
Priority nature conservation areas
vegetation management risk matrix
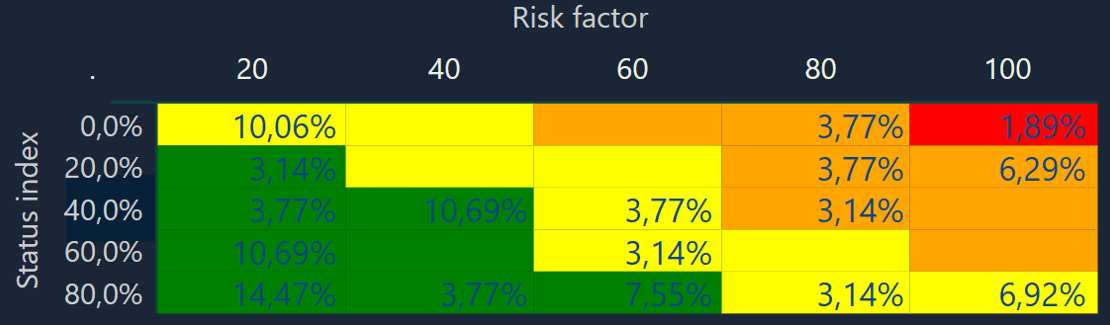
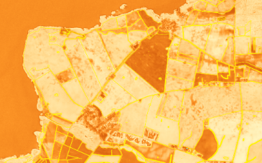
Our company has developed the display of satellite images and data collected by the car-mounted camera system in a Vegetation matrix.
We determined the current state of the vegetation, the location of the vegetation in the safety zone in relation to the network, and also determined height categories within it. Considering the nature of the vegetation, we created a growth model taking into account the change.
The other vector of the matrix was weighted by the effect of vegetation on the network. Malfunction statistics, the number of consumers supplied, and, where applicable, the life protection classification.
The network elements (electrical network sections) have been placed in a matrix, where, based on the data assigned to them, we can properly coordinate the intervention priority based on their location within the matrix.
How to claim the free demo (BASIC)?
Selection of pilot area (approx. 50 km continuous network)
Handover of electrical network topology
Analysis of satellite images in the affected sectors
Connecting the analysis to topology
Display on dashboard interface
Evaluation together with customer
Order – if the customer so decides
You can find our car mounted low-voltage vegetation management system here:
Frequently asked questions
If you have any question, please let us know, and we will publish the answer.
Yes. Of course, this can vary depending on the voltage level, where appropriate, several zones and height categories can be defined.
If the weather conditions in the given area are suitable, the database can be created in about 2 weeks.
Any option is possible and will be implemented entirely based on the customer’s needs.
Yes. Soon, an ordering interface will be added to the website, where you can order completely remotely – from anywhere in the world – and start using it immediately.
Yes, we basically process the relevant satellite sectors based on the database and display the result of the processing on the HAWK GRID platform.
Yes. 4 in 1 function. More precisely, the intervention must be carried out manually by lumbermen, but all operations during the process can be logged and, where appropriate, can also be checked virtually by uploading manual images from drones.
More products
Our other solutions that might be interesting for you.
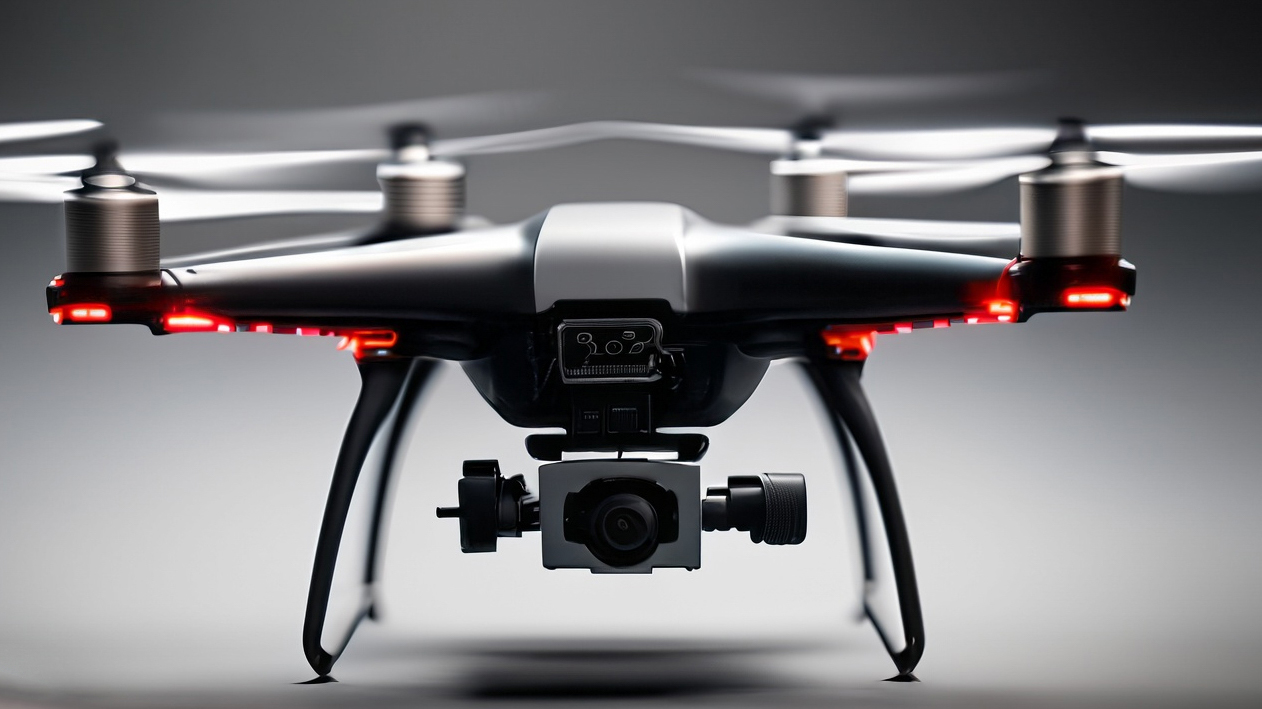
Drone detection
Electrical network inspection from the air with drone camera detection. AI supported automated flight paths and data capture.

Railway Systems
The Rail Hawk System can detect the status of objects in the railway track environment and give signals if an object needs to be repaired.

Car detection
Electrical network inspection from land with car camera detetection. Camera system can be placed for any vehicle.